Is Vanuatu Sinking?
The Truth About Sea Levels Before You Buy Land
written by Justine Murray 13th April 2026 7 min Read
Is Vanuatu Actually Sinking?
Vanuatu is not sinking. But some coastal areas are changing, and that matters if you’re buying land near the beach.
If you’re looking at land in Vanuatu, here’s what you actually need to know before making a decision.
No, Vanuatu is not sinking. However, like many island nations, some low-lying coastal areas are experiencing gradual changes due to tides, weather patterns, and long-term sea level trends. The key is understanding where to buy and what land is actually safe.
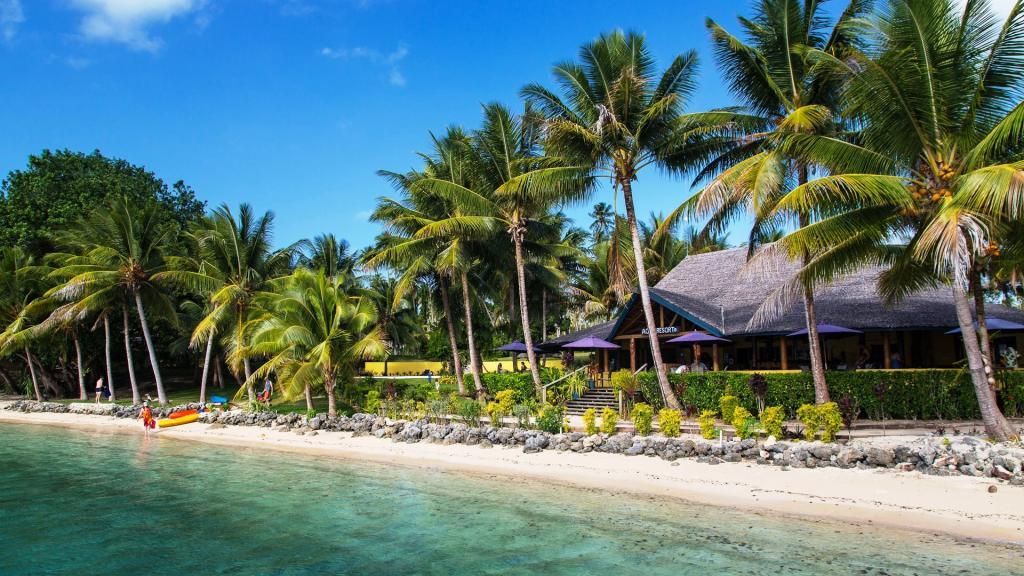
The Republic of Vanuatu, a scattered Pacific island nation of fewer than 400,000 people, has emerged as a frontline symbol in the global climate debate. Year after year, Vanuatu’s government warns that sea levels are rising at an alarming pace, threatening to submerge homes, wipe out livelihoods, and force wholesale relocation of its people. At the same time, critics accuse Vanuatu of exaggerating the risks in order to attract climate adaptation funding.
Where is safe to buy land in Vanuatu?
Not all land in Vanuatu carries the same risk. The key is choosing elevated positions, staying back from the immediate shoreline, and focusing on areas with proven long-term development. Inland or slightly raised coastal land offers significantly more stability and long-term value compared to low-lying beachfront sections.
Not all land is equal. The difference comes down to elevation, location, and planning.
Best areas to buy land in Vanuatu (low risk)
Higher elevation land on islands like Aore provides natural protection from tidal changes while still offering ocean views. Areas set back from the coastline, but within close access to the water, are consistently more reliable for both lifestyle and investment. Established zones with existing homes, access, and infrastructure also reduce risk compared to undeveloped or reclaimed land.
So what does this mean for buying land in Vanuatu?
What actually matters when buying land in Vanuatu
Forget the headlines. Sea level data only matters if you are buying the wrong type of land. What actually matters when buying land in Vanuatu Most buyers focus on sea level headlines. That’s the wrong move. The real risk comes down to where you buy, not whether Vanuatu is “sinking.”
Focus on this instead:
- Elevation Land even a few metres above sea level dramatically reduces long-term risk.
- Distance from shoreline Direct beachfront looks good but carries the highest exposure. Set-back houses holds value better.
- Natural protection Reefs, mangroves, and bays reduce wave energy and erosion.
- Existing development If homes have been standing for years, that tells you more than any report.
- Water and drainage Check how water moves on the land during heavy rain. Flooding causes more issues than sea level rise.
If you get these right, you eliminate most of the real risk.
The Hard Numbers: Sea Levels in Vanuatu
Satellite Evidence
Since the launch of global satellite altimetry in 1993, scientists have been able to track sea-level changes across the world’s oceans with unprecedented precision. In the Western Pacific, where Vanuatu sits, satellite records show some of the fastest-rising seas on the planet in many locations, 4.5 to 6 mm per year.
This figure is well above the global mean of ~3.3 mm per year, as reported by the IPCC. Trade winds, El Niño–Southern Oscillation cycles, and ocean current dynamics amplify the rise in the Western Pacific, creating hotspots like Vanuatu.
Tide Gauge Records
Closer to home, the Port Vila tide gauge (PSMSL station 1841) provides ground-truth data. Its record, covering 1993 to 2016, shows a lower but still significant trend of ~3.1 mm per year, with adjustments for barometric pressure and vertical land motion dropping the figure to ~2.2 mm.
The discrepancy matters. Tide gauges reflect local conditions, including land uplift or subsidence, while satellites measure absolute sea-surface height. For coastal planning, the tide gauge is what determines whether beaches erode or wells turn salty.
What Vanuatu Claims
Official government and NGO-backed reports often cite 6 mm per year as the country’s sea-level rise rate. This figure has been repeated in UN submissions, climate adaptation brochures, and speeches before international forums.
Critics point out that the upper-bound estimate has become the default talking point, while lower gauge-based numbers are rarely highlighted. The choice of which figure to emphasize carries consequences both in perception and in dollars.
Benchmarking Against Australia and the World
Australia’s Rising Seas
Australia’s long-term sea-level rise has been slower than Vanuatu’s, averaging ~2.1 mm per year over the past half century. However, acceleration is now clear: studies show the trend is climbing towards 2.5–3 mm per year, especially along the eastern seaboard.
In Sydney, Fremantle, and Brisbane, tide gauges confirm this gradual but steady upward curve. Projections indicate a rise of ~26 cm by 2050 relative to 1995–2014 averages, and up to 0.8 m by 2100 in high-emissions scenarios.
Global Average
Globally, satellite data point to a consistent ~3.3 mm per year rise over the past 30 years, with acceleration since the early 2000s due to ice-sheet melt.
Following the Money: Climate Finance
anuatu’s Funding
Green Climate Fund (GCF): Over USD 296,000 in readiness grants; larger multi-million projects approved later.
Vanuatu Coastal Adaptation Project (VCAP, 2014–2018): UNDP-managed, funded by the Global Environment Facility and Least Developed Countries Fund. Focused on seawalls, coastal road reinforcement, and community relocation pilots.
FP184 (GCF Project): Targeting resilience in agriculture, fisheries, and early-warning systems.
Loss & Damage Fund Applications: Vanuatu has positioned itself as a global leader advocating for financial compensation for “slow-onset events” like sea-level rise, citing a baseline adaptation need of USD 177 million.
Australia’s Spending
In contrast, Australia’s adaptation budget runs into billions, integrated into state and federal coastal management. Examples:
New South Wales projects 40,000 coastal properties at risk of inundation under a 1-m rise.
Queensland’s Gold Coast adaptation plan assumes 0.8 m rise by 2100, requiring multi-million-dollar protective works.
Australia’s spending dwarfs Vanuatu’s, but per capita, the Ni-Vanuatu case is far sharper — climate aid can account for up to 10% of GDP-equivalent inflows in some years.
What this actually means for you as a buyer
Ignore the politics and funding headlines.
Here’s the reality:
- The biggest risk is not Vanuatu.
The biggest risk is buying the wrong block of land. - Well-positioned land in Vanuatu continues to hold value because:
- It is limited
- It is elevated
- It is chosen carefully
- Low-lying, poorly planned land is where problems show up first.
This is why two properties 200 metres apart can have completely different long-term outcomes.
If you focus on elevation, drainage, and position, you’re not speculating, you’re selecting.
How Narrative Shapes Policy
Vanuatu’s vulnerability is real. Low-lying islands already face saltwater intrusion, eroding shorelines, and forced relocations. But the
incentive to emphasize the highest risk figure is obvious: it secures attention and funding in a competitive climate finance landscape. By foregrounding the
6 mm/year figure, Vanuatu positions itself as the canary in the coal mine a strategy that has brought millions in grants and project aid.
What buyers need to understand
Vanuatu is not sinking. But not all land is equal. Some coastal areas will change over time. That’s normal across the Pacific and Australia. The difference comes down to where you buy.
Smart buyers focus on:
- Elevated land
- Set-back positions from the shoreline
- Proven areas with existing homes
Get that right, and you remove most of the real risk. Get it wrong, and no headline will save the investment. This is why experienced buyers don’t chase the cheapest beachfront block — they choose land that holds value long term.
Frequently asked questions about rising sea levels
Q: How fast is sea level rising in Vanuatu?
Q: How fast is sea level rising in Vanuatu?
A: Independent tide gauge records show about 2.2–3.1 mm per year, while satellite data indicate 4.5–6 mm per year.
Q: How does this compare to Australia?
Q: How does this compare to Australia?
A: Australia’s average long-term rise is slower at ~2.1 mm per year, though it is accelerating toward 2.5–3 mm per year.
Q: What is the global average?
Q: What is the global average?
A: The IPCC reports ~3.3 mm per year globally since the 1990s.
Q: Why does Vanuatu’s government say 6 mm per year?
Q: Why does Vanuatu’s government say 6 mm per year?
A: 6 mm per year is the upper-bound satellite estimate; emphasizing it strengthens claims for adaptation funding and global climate advocacy.
Q: How much climate funding has Vanuatu received?
Q: How much climate funding has Vanuatu received?
A: Projects include millions from the Green Climate Fund (GCF), Global Environment Facility, and UNDP adaptation programs, with a stated baseline funding need of USD 177 million.
Q: What are the impacts in Vanuatu today?
Q: What are the impacts in Vanuatu today?
A: Saltwater intrusion into wells, coastal erosion, and early relocation of at-risk communities.
Q: What about Australia?
Q: What about Australia?
A: Coastal property, infrastructure, and insurance costs are the main risks, with projections of 0.26 m rise by 2050 and up to 0.8 m by 2100.
Have a question contact us